IoT Freezer :: To monitor the effectiveness of an off-grid solar freezer solution. The first phase being the constant monitoring of the temperature inside the freezer.
Description:
This project is part of an off-grid life-style experiment. A quarter of a beast is 27-35kg of butchered meat, and will fit in a 145L freezer. That volume should last a family of three for 5 months. A 145L chest freezer consumes approximately 296 kWh/year (0.8 kWh/day). A locally sourced 470W off-gird solar package will supply 1.2kWh/day for 2 days from 4 x 12v @ 105Ah sealed AGM batteries (to 50% capacity), when there is no sun.
As someone who's eaten chicken from a fridge with a failing compressor, and before we go and put $350 worth of beef on an experimental power source, I thought it would be wise to track the temperature of the freezer for a while, and see if the numbers really pan out.
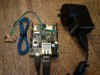
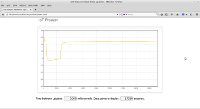
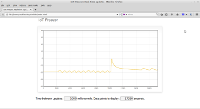
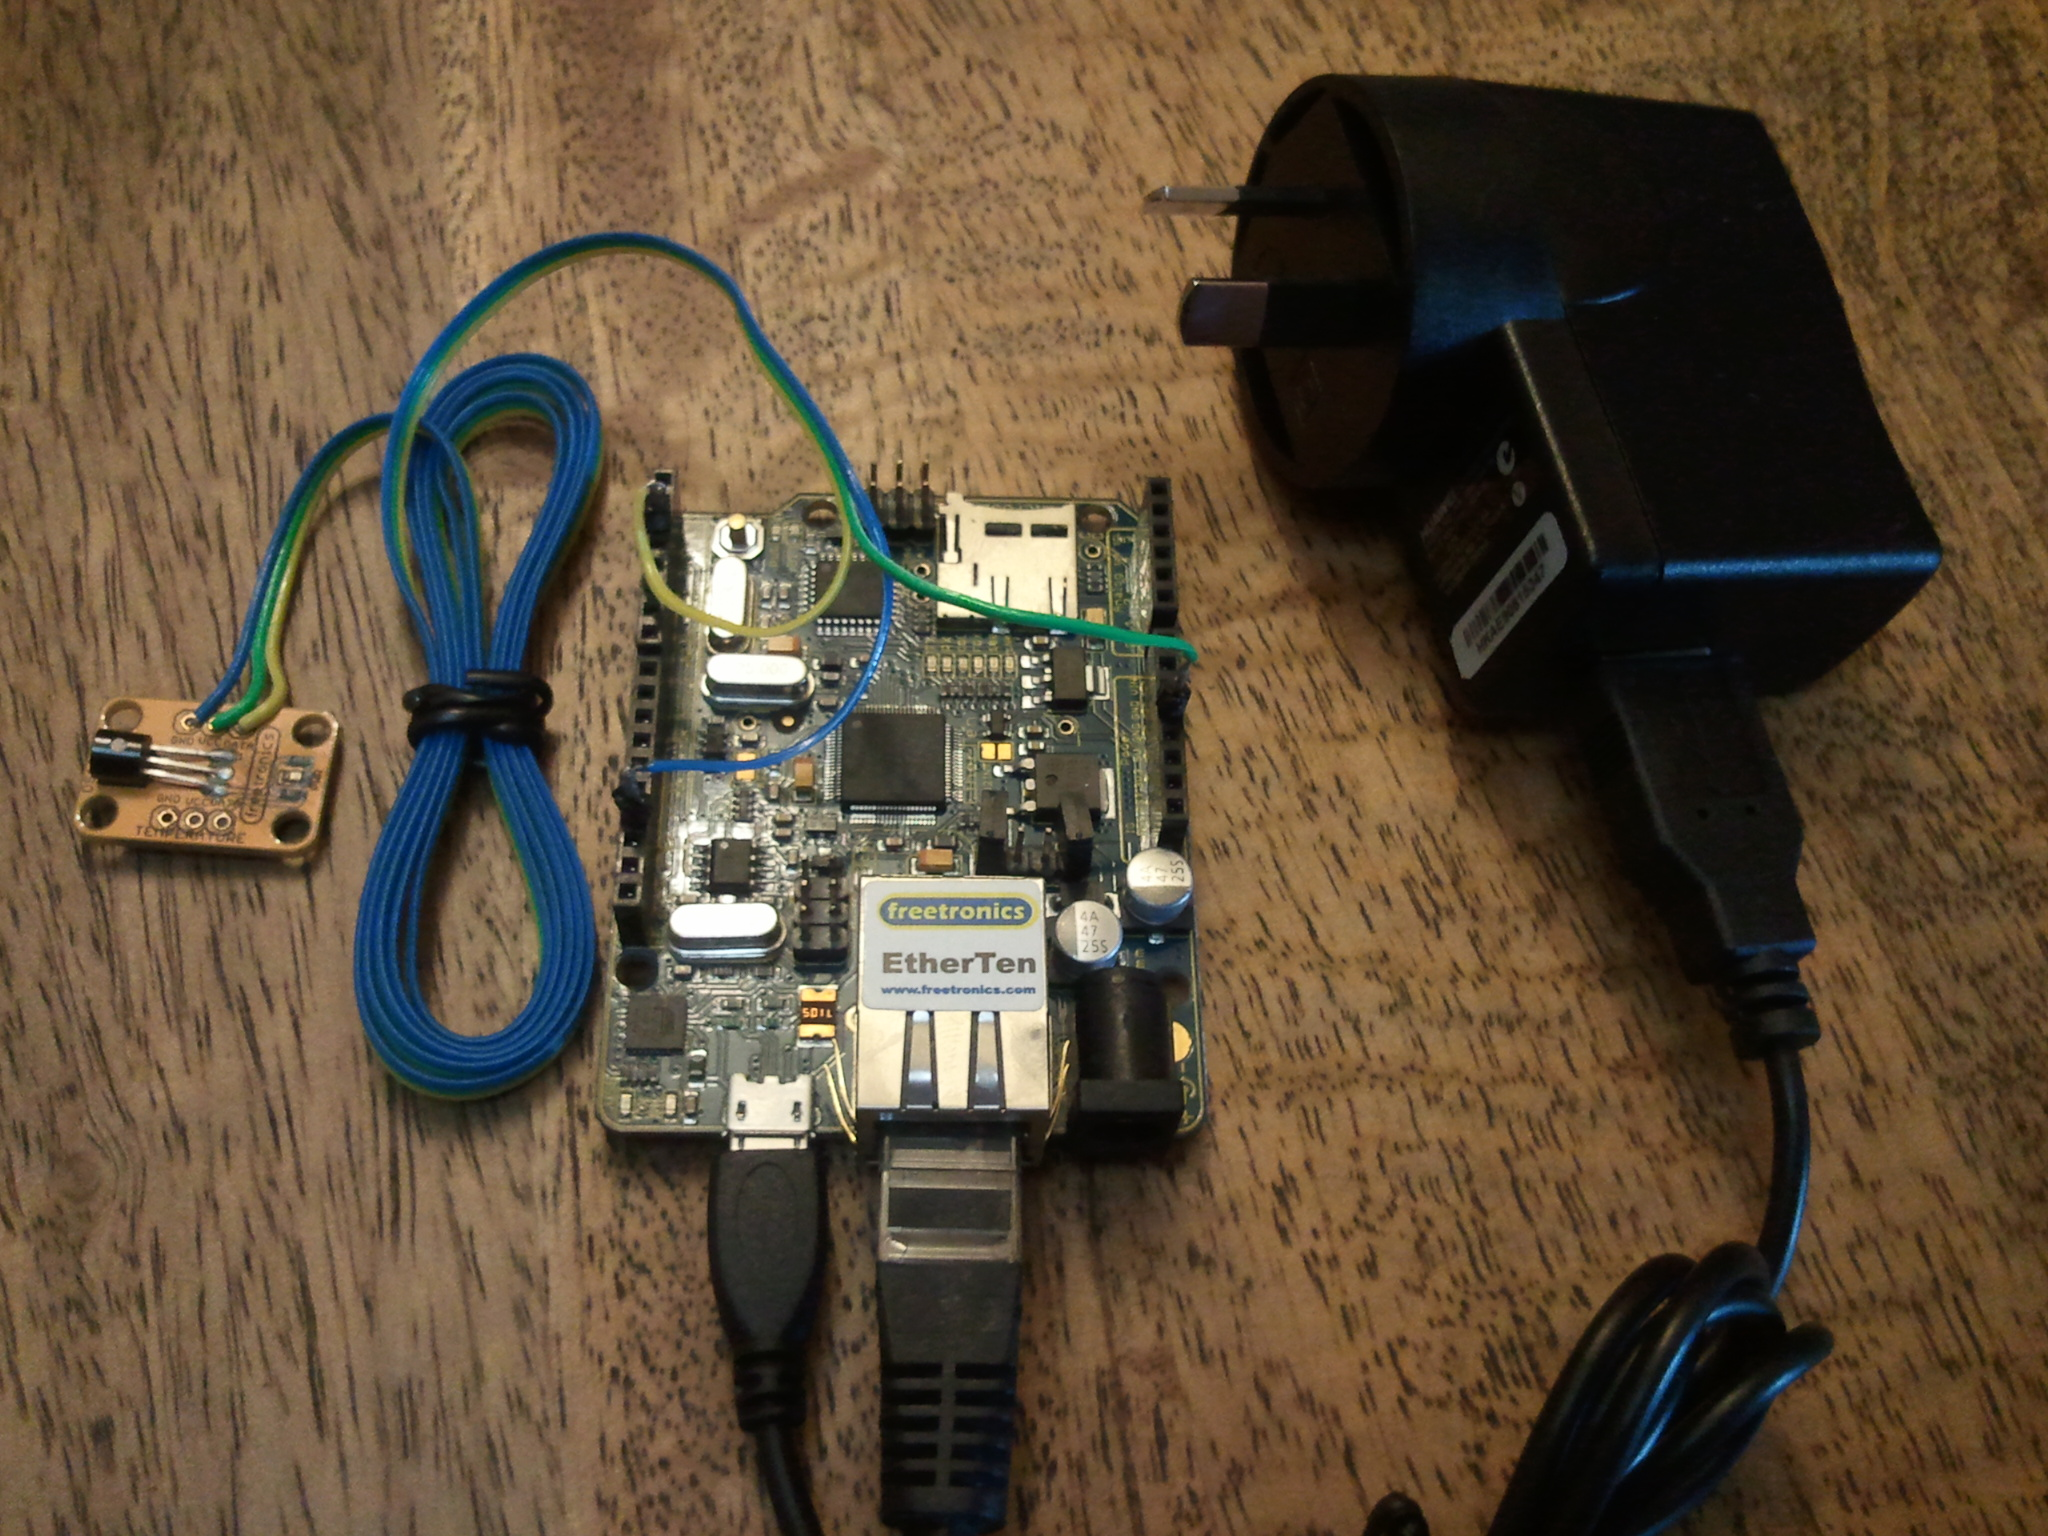
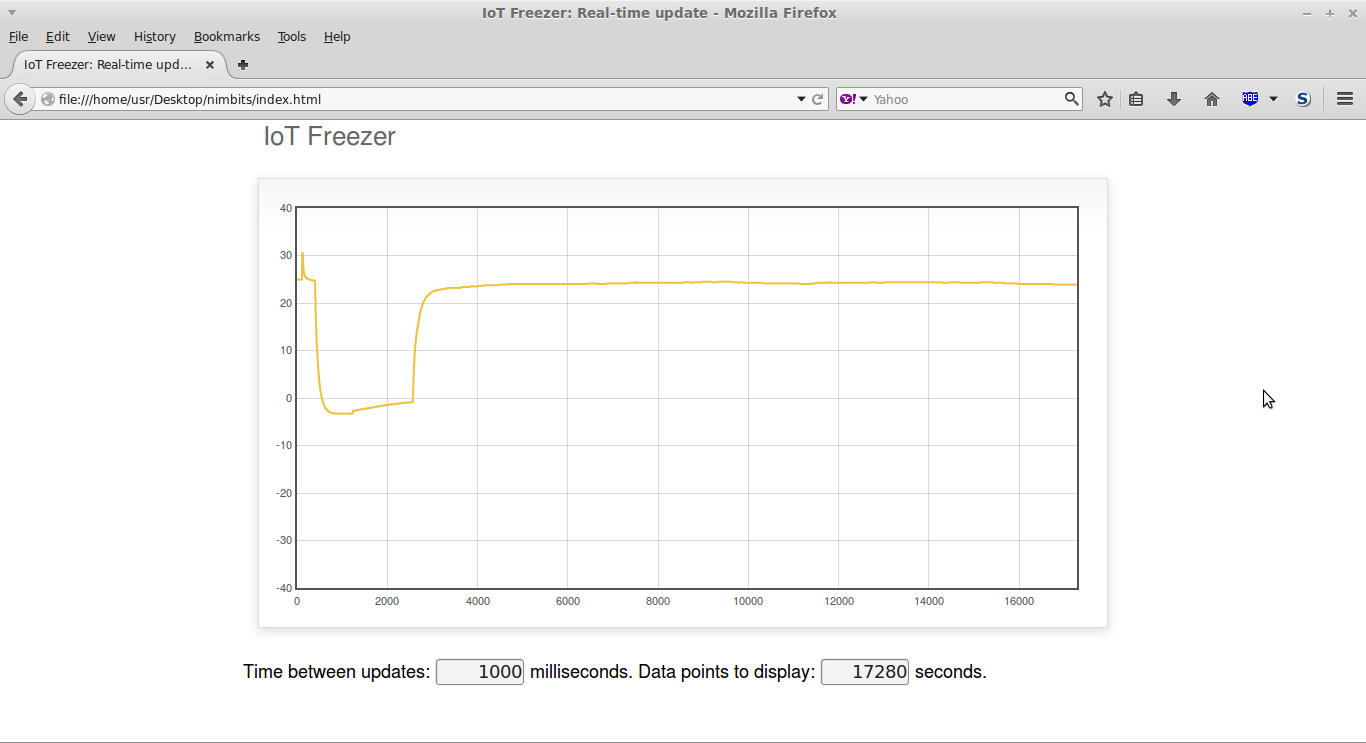
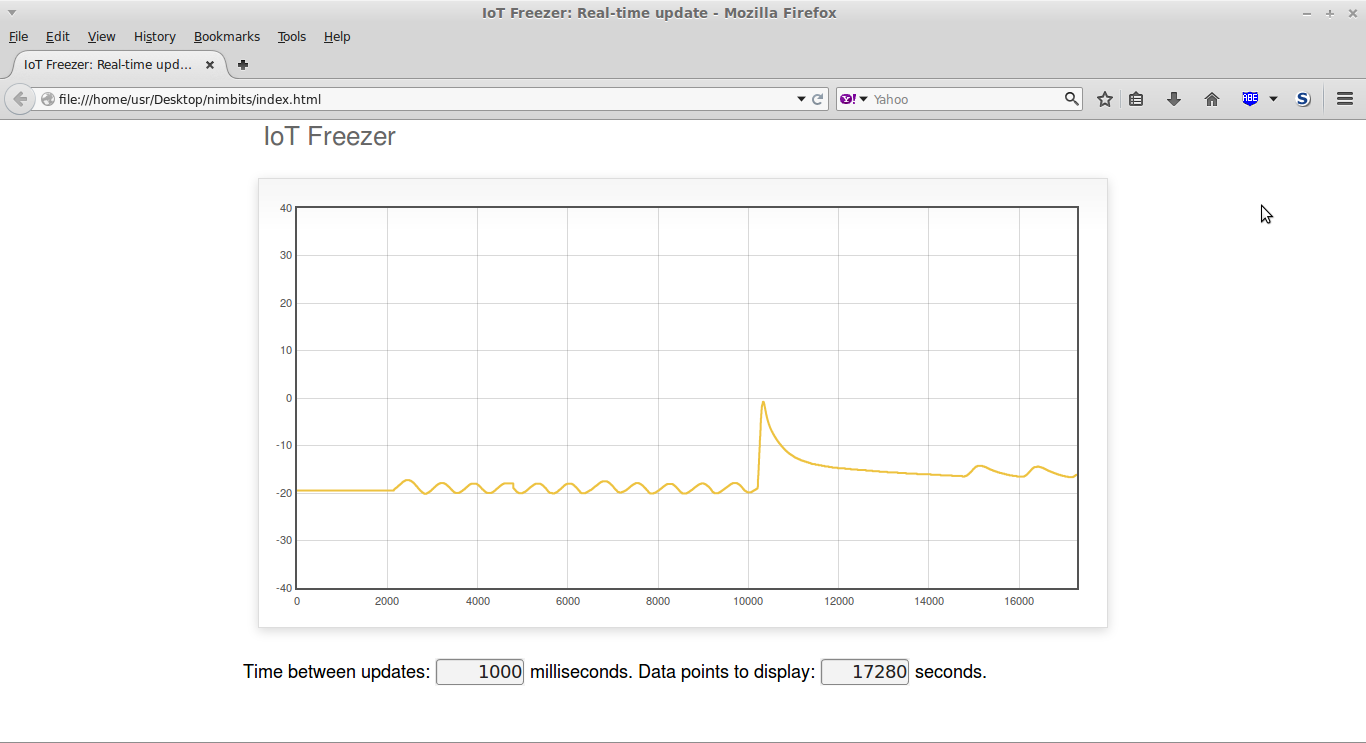
In the first phase (Mar 15), a temperature sensor has been combined with an Arduino EtherTen to provide periodic (5 second interval) updates to the Nimbits "Internet of Things" cloud platform. This data point is then graphed via the Flot javascript charting library.
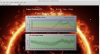
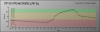
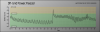
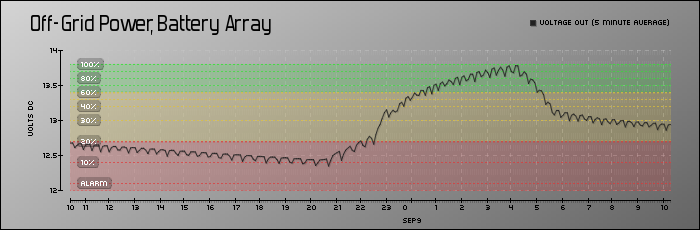
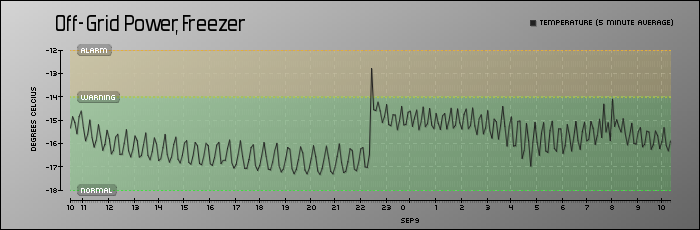
In the second phase (Sep 15), the off-grid solar power supply was deployed, the freezer was migrated off the mains supply to the new supply and then a new Arduino IoT voltage sensor node was added to monitor the output voltage of the solar charged battery bank. The IoT temperature sensor from phase one was upgraded to be both a sensor node and a network connected hub. The voltage sensor node sends voltage data via a software serial uplink interface to the hub. In phase two the Nimbits cloud service has been replaced with a local Key-Value database (source code also provided below). A console site based on Bootstrap presents the pChart based graphs to the end user.